


Monthly EIA 914 Report

With a title like that, you just know you want to read all about it. But it's Super Bowl Sunday and once a month, we get to enjoy the guilty pleasure of government data (somebody pass the popcorn!).
On Friday, the EIA released it's "official" monthly production numbers and they show just how important it was to hit Q3 and Q4 production targets that had been set at the beginning of 2019. The number of companies I heard about running ESPs, not shutting down completion crews etc. just to "make the numbers" was... in a word... sickening. It's idiotic, it leads to bad prices, lower revenue and ultimately massive losses for equity and debt holders alike... but at least they made their numbers. I digress. Let's start with oil.
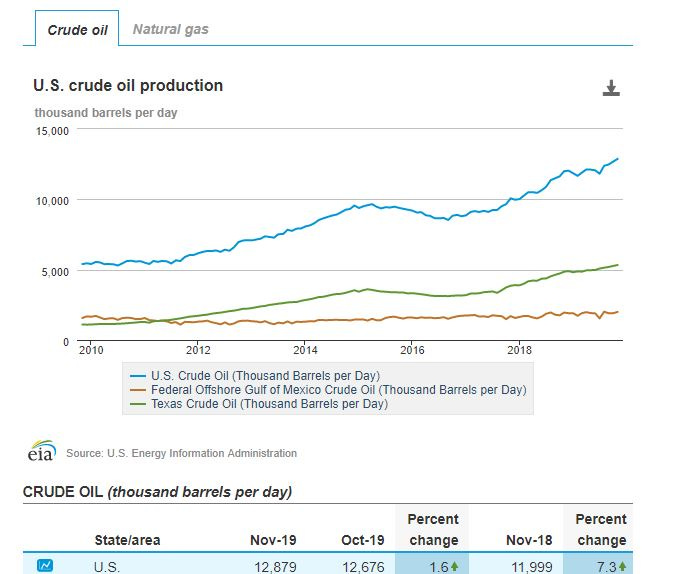
Since June, oil production is up ~700 mbo/d with half of that coming from the Permian and now, the U.S. is producing almost 12.9 mmbo/d. When I made the "peak oil U.S.A" call in September, I had compiled capital numbers from the major producers and their Q3/Q4 pace looked to be down 33% from Q2. Production was pretty flat January - June, so it stood to reason decreased activity would bring decreased production (and increased prices!).
But... something changed- or rather capital activity remained focused on completion activity.
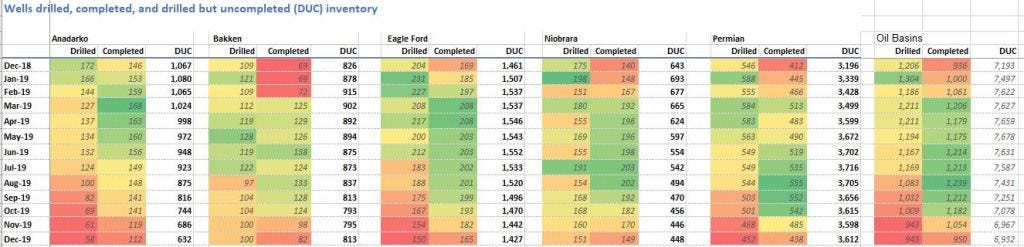
October "oily basin" completions were 1,182, 4% below the peak 2019 completion pace hit in August. November production, driven by October completions (frac during the month, start flowback and through clean up with oil the next month). If you wanted a snapshot as to how important hitting production targets were, that's exhibit A. Exhibit B is the fall off in completion pace for December (which drives January production), down 23% from the August peak.
How does this project forward to January (with thanks to PrimaryVision Frac Spread)?
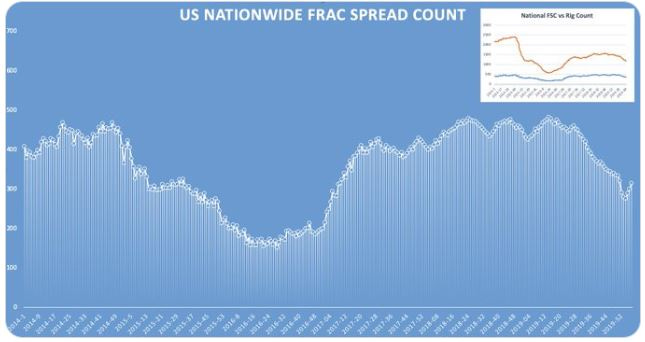
A "V" shape recovery in active frac spreads took place in January but still suggests completions will be down 28% from the August (~950 is my estimate for January).
So with November through January completion pace substantially lower than the 2019 run rate PLUS $51/bbl : $1.80/mcf gas (~0 at Waha) PLUS coronavirus/global demand concerns driving caution in March, I think we are finally where I thought we would be in September: past peak production U.S.A. and on the decline. The next few months will confirm.
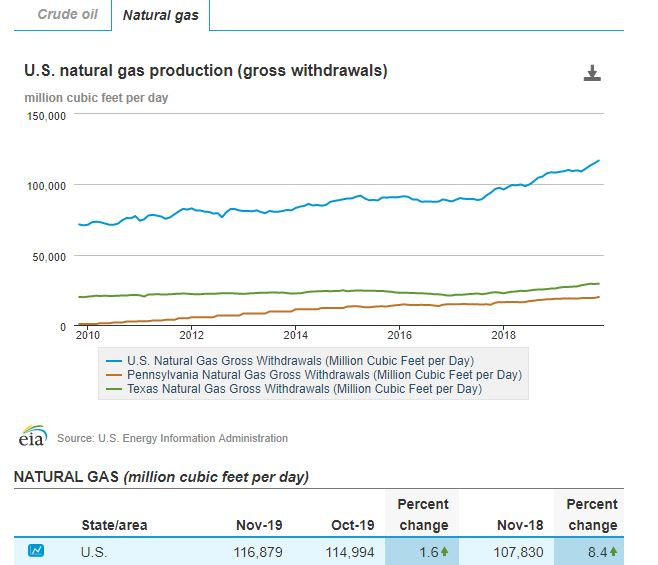
As for gas... the chart says it all. Up 7% since June and Appalachia shows no sign of slowing down. Not surprisingly, natural gas prices are reflecting that.
I'm starting to feel like I need to give a supply-demand seminar for E&P execs because as Gwen Stefani would say: "This sh*t is bananas. B.A.N.A.N.A.S"